Monitoring and managing ambient air quality is an important part of Mid West Ports’ environmental responsibilities. Mid West Ports continually works to minimise dust emissions and potential impacts of port operations.
Air quality is monitored around the Geraldton Port boundary using an extensive network of real‑time monitoring equipment. This portal shares near real‑time dust and wind information to provide transparency to the community in understanding air quality conditions.
Berth 1

Connell Road

Lemmon Road

Port Way

Kempton Street (Background)
")
Wind

Understanding Our Air Quality Portal
Mid West Ports monitors air quality in and around the Geraldton Port to manage dust emissions and share information transparently with the community.
This Air Quality Portal provides near real‑time information about PM₁₀ dust levels, air quality categories, and wind conditions measured at monitoring stations around the Port.
What is PM10?
PM₁₀ refers to particulate matter (dust) that is smaller than 10 microns in diameter. These fine particles are not visible to the naked eye.
PM₁₀ levels are measured in micrograms per cubic metre of air (µg/m³).
Higher numbers indicate more dust in the air.
How Air Quality is Monitored
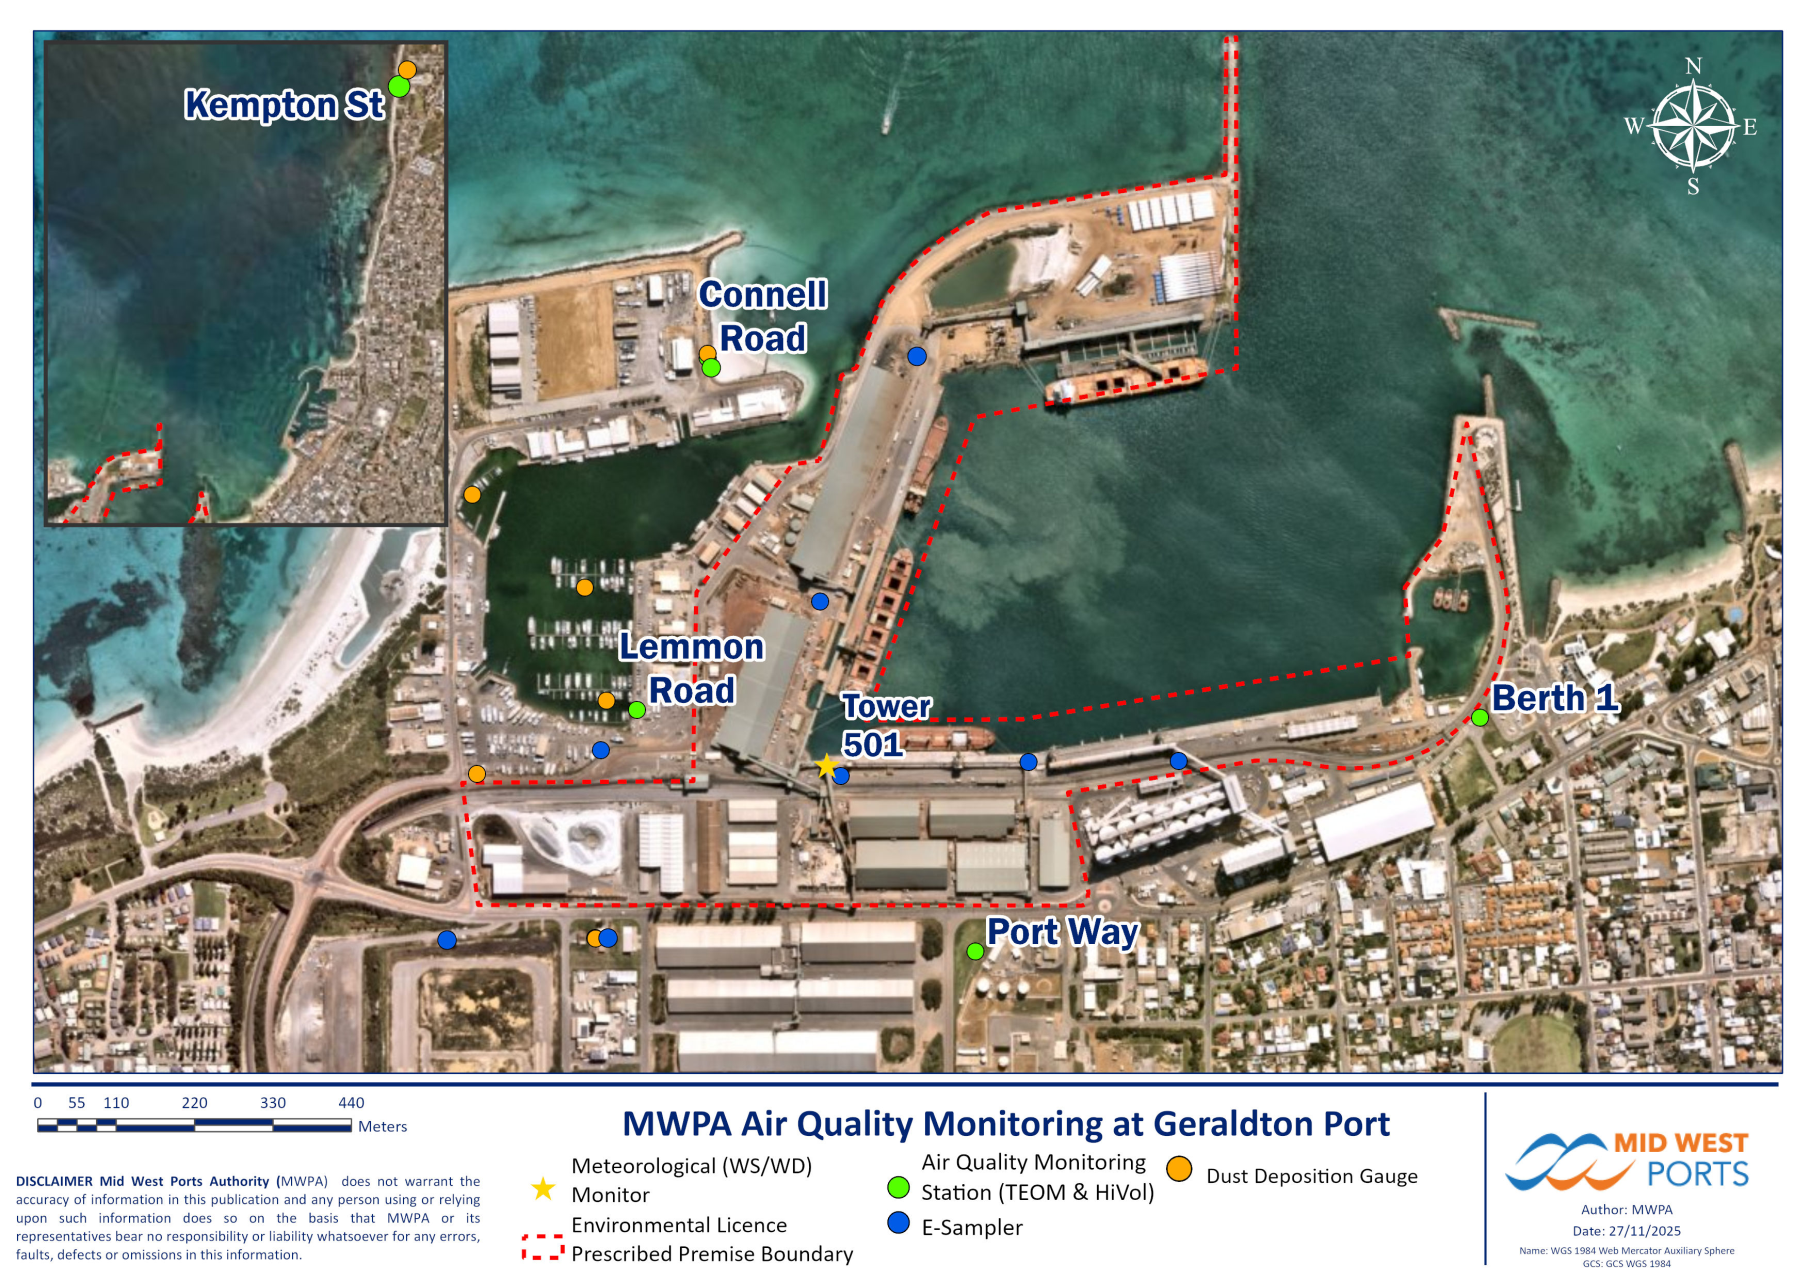
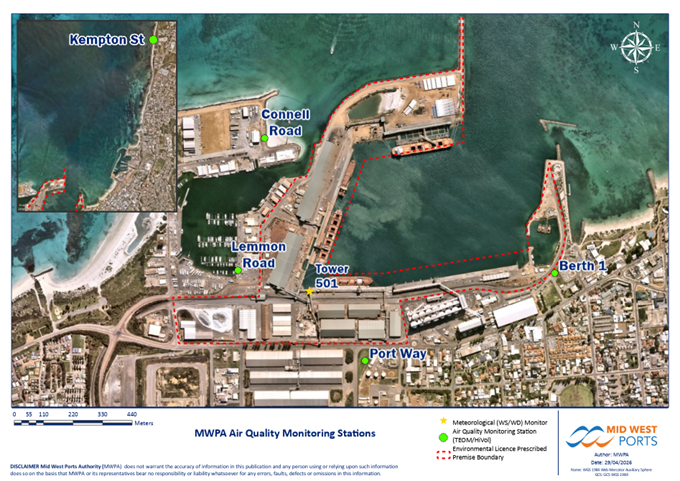
Mid West Ports operates a network of real‑time PM₁₀ monitoring stations located around the Port boundary, including:
- Port Way
- Connell Road
- Lemmon Road
- Berth 1
These stations continuously measure dust levels and send data to Mid West Ports servers for display on this portal.
A background monitoring station is also located outside the Port area in the suburb of Bluff Point (Kempton St).
Data shown on the portal is unvalidated real‑time data, meaning it may occasionally include interruptions or instrument errors. Final validated results are reported formally under Mid West Ports’ regulatory obligations to the Department of Water and Environmental Regulation (DWER). These reports are published on our website and can be viewed here: Air Quality Monitoring Reports
.
1 hour Average Dust Levels
The portal displays 1‑hour average PM₁₀ concentrations, updated every clock hour.
Each value represents the average dust concentration measured over the previous hour.
Results align with DWER air quality reporting framework used across Western Australia.
Short‑term increases in PM₁₀ can occur due to a range of factors, including weather conditions, regional activities, or local sources - not only port operations.
What is the Air Quality Index (AQI)?
MWPA applies the DWER Air Quality Index (AQI) to categorise dust levels.
The AQI converts measured PM₁₀ concentrations into a simple number and colour category, helping to quickly understand current air quality conditions.
The AQI is based on the National Environment Protection Measure (NEPM) for ambient air quality, with the national PM₁₀ standard being 50 µg/m³ averaged over a 24 hour period.
AQI Categories
This portal uses the DWER five‑category colour system for PM₁₀:
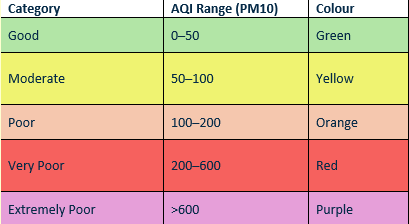
When PM10 concentrations are recorded as Poor or above, Mid West Ports investigates the cause and takes action where emissions are confirmed to be Port‑related.
Understanding Wind Conditions
Wind plays an important role in how dust moves through the environment.
The portal displays:
- Wind direction – shown as the direction the wind is coming from (for example, a south‑east wind blows from the south‑east)
- Wind speed – described using the Beaufort Wind Scale, ranging from calm conditions to very strong winds
Wind information helps explain:
- Why dust levels may rise or fall
- Whether dust is likely moving toward or away from the Port
- Whether dust may be coming from sources outside the Port area.
Why Dust Levels Aren't Always Caused by the Port
Not all dust recorded by the monitoring stations comes from Port activities.
The monitors measure all PM₁₀ in the air, including dust from external and regional sources that Mid West Ports does not control.
These sources can include:
- Wind‑blown sand from beaches and coastal areas
- Dust from surrounding land and natural terrain
- Sea salt particles, which are common in coastal environments
- Regional weather events, such as hot, dry and windy conditions
- Activities occurring outside the Port, such as transport, construction, or agriculture
During these conditions, several monitoring stations - including the background monitor - may record high values at the same time. This usually indicates a regional source of dust.
How Mid West Ports Determines Whether Dust Is Port-Related
When elevated dust levels occur, Mid West Ports investigates all available data to understand the source of the dust, and considers:
- Wind direction and wind speed
- Which monitoring stations are affected and when
- Whether monitors upwind of the Port are also elevated
- Readings at the background monitoring station
- Visual observations of dust
- Whether dust levels change when Port activities are paused
Important Notes for Portal Users
This portal is provided as a community information tool to support transparency and understanding of air quality surrounding the Port.
- Data shown is unvalidated
- Not all elevated dust readings are caused by Port operations
- Weather and regional conditions can strongly influence air quality results
- Mid West Ports investigates elevated dust levels and applies dust control measures where required
- Formal compliance reporting is provided to DWER in accordance with Mid West Port’s Environmental Licence
Additional Monitoring Programs
High Volume Air Sampling (HiVol)
High Volume Air Sampling is also a licence-based requirement during the loading of metal concentrate products. This monitoring provides a measure of specific metals which are present in bulk products handled at the port, as PM10 particles in air. High Volume Air Samplers (HiVols) are located at all four air quality monitoring stations around the Port boundary. Dust is collected on filters over a 24-hour period and sent to an accredited laboratory for analysis. The results are compared against the regulatory criteria set out in the Environmental Licence.
Dust Deposition
Dust deposition monitoring is a voluntary program undertaken by MWPA to assess the longer-term environmental tends in the Fishing Boat Harbour (FBH) precinct. This program provides a measure of dust deposition rates on infrastructure and is used to assess impact to public amenity (nuisance dust) rather than public health.
Six dust deposition gauges are located throughout the FBH, and results are compared against reference sites outside the port to identify any localised increases and seasonal trends.
Dust deposition monitoring locations have been carefully chosen to capture dust from both Port-controlled and non-Port-controlled sources, based on their position relative to operational activities and prevailing wind directions.
The depositional dust gauges collect deposited material over a one-month period and are then analysed to determine levels of organic matter, metals, soluble solids and insoluble solids. MWPA assesses results against the Draft DWER Guideline: Dust Emissions (2021):
- 4 g/m²/month maximum for insoluble solids; and
- 2 g/m²/month above background for insoluble solids.
This voluntary program helps identify dust sources, assess potential impacts from port operations, and track the effectiveness of dust controls. Regular data collection also allows MWPA to engage with FBH users and guide improvements where needed.