MWPA Offshore Met Wind Data (Beacon 1 Met 1)

Geraldton

Thursday, 2 July 2026
22:50

Data Breakdown
Wind Direction SE
Wind Speed(10 min average) 12kn
Gust (2min) 15kn
Barometer 1023.2hPa
Sea Temp -99.9°
Air Temp 1.5°
Offshore Met Wind Data (Beacon 1)
MWPA Offshore Met Wind Data (Beacon 1 Met 2)

Geraldton

Thursday, 2 July 2026
22:51

Data Breakdown
Wind Direction SE
Wind Speed(10 min average) 11kn
Gust (2min) 14kn
Barometer 1022.8hPa
Sea Temp -99.9°
Air Temp 1.5°
Offshore Met Wind Data (Beacon 1)
MWPA Near Coast Met Wind Data (Beacon 18)

Geraldton

Thursday, 2 July 2026
22:51

Data Breakdown
Wind Direction SE
Wind Speed(10 min average) 10kn
Gust (2min) 14kn
Barometer 1023hPa
Sea Temp -99.9°
Air Temp 1.4°
Offshore Met Wind Data (Beacon 1)
Outer Channel Waverider (B2)

Geraldton

Thursday, 2 July 2026
22:45

Data Breakdown
Swell (Hs) 1.66m
Swell Direction 243°
Mean Period 12.4sec
Peak Energy Period 14sec
Sea (Hs) 0.93m
Sea Direction 238°
Mean Period 4.9sec
Peak Energy Period 7.2sec
Total (Hs) 1.9m
Mean Period 9.1sec
Peak Energy Period 14sec
Maximum Single Wave 3.26m
(recorded previous 15 minutes)
Period 13.9sec
Length 155m
Main Shipping Channel Entrance Wave Data
Data
Date Time Total Sea Swell
    Height Period Height Period Height Period
2/07/2026 10:30:00 PM 1.99m 9.58s 0.87m 4.72s 1.79m 12.68s
2/07/2026 10:15:00 PM 1.94m 9.33s 0.93m 4.87s 1.7m 12.93s
2/07/2026 10:00:00 PM 2.02m 9.38s 0.99m 5.01s 1.76m 12.91s
2/07/2026 9:45:00 PM 1.86m 8.91s 0.98m 5.05s 1.58m 12.6s
2/07/2026 9:30:00 PM 1.8m 8.91s 0.9m 4.85s 1.57m 12.26s
2/07/2026 9:15:00 PM 1.85m 9.5s 0.87m 4.94s 1.64m 12.86s
2/07/2026 9:00:00 PM 1.92m 9.98s 0.85m 5.13s 1.72m 12.94s

Hs, the Significant Wave Height, may be defined as the average of the highest one-third of waves and is sometimes described as the wave height which would be reported by an experienced observer. The wave climate at any location can be, and usually is, a combination of sea and swell and is often referred to as the total wave. At Geraldton, the division of sea and swell has been set as 8 second period waves.

Main Shipping Channel Entrance Wave Data (Beacon 1 AWAC)

Geraldton

Thursday, 2 July 2026
22:45

Data Breakdown
Swell (Hs) 1.64m
Swell Direction 240°
Mean Period 12.7sec
Peak Energy Period 12.8sec
Sea (Hs) 0.95m
Sea Direction 216°
Mean Period 4.8sec
Peak Energy Period 7.9sec
Total (Hs) 1.9m
Mean Period 8.9sec
Peak Energy Period 12.8sec
Maximum Single Wave 2.59m
(recorded previous 15 minutes)
Period 12.5sec
Length 133m
Main Shipping Channel Entrance Wave Data
Data
Date Time Total Sea Swell
    Height Period Height Period Height Period
2/07/2026 10:25:00 PM 2m 9.45s 0.99m 4.89s 1.74m 13.48s
2/07/2026 10:05:00 PM 1.93m 9.45s 0.88m 4.69s 1.71m 12.93s
2/07/2026 9:45:00 PM 1.73m 8.77s 0.91m 4.64s 1.48m 13.21s
2/07/2026 9:25:00 PM 1.69m 8.79s 0.86m 4.65s 1.45m 12.81s
2/07/2026 9:05:00 PM 2.09m 10.43s 0.82m 4.69s 1.92m 13.5s
2/07/2026 8:45:00 PM 1.86m 10.04s 0.82m 4.78s 1.67m 13.65s
2/07/2026 8:25:00 PM 1.99m 10.05s 0.85m 5.02s 1.8m 12.98s

Hs, the Significant Wave Height, may be defined as the average of the highest one-third of waves and is sometimes described as the wave height which would be reported by an experienced observer. The wave climate at any location can be, and usually is, a combination of sea and swell and is often referred to as the total wave. At Geraldton, the division of sea and swell has been set as 8 second period waves.

Main Shipping Channel Entrance Wave Data (Beacon 2 AWAC)

Geraldton

Wednesday, 5 March 2025
16:28

Data Breakdown
Swell (Hs) 1.86m
Swell Direction 252°
Mean Period 13sec
Peak Energy Period 14.6sec
Sea (Hs) 0.99m
Sea Direction 231°
Mean Period 4.2sec
Peak Energy Period 7.7sec
Total (Hs) 2.1m
Mean Period 8.9sec
Peak Energy Period 14.6sec
Maximum Single Wave 3.96m
(recorded previous 15 minutes)
Period 14.7sec
Length 164m
Main Shipping Channel Entrance Wave Data
Data
Date Time Total Sea Swell
    Height Period Height Period Height Period
5/03/2025 4:08:00 PM 1.84m 8.18s 0.89m 3.92s 1.61m 12.27s
5/03/2025 3:48:00 PM 1.87m 8.71s 0.88m 4.04s 1.64m 13.09s
5/03/2025 3:28:00 PM 1.91m 8.87s 0.9m 4.14s 1.69m 13.08s
5/03/2025 3:08:00 PM 1.76m 8.22s 0.85m 4.08s 1.54m 11.86s
5/03/2025 2:48:00 PM 1.81m 8.46s 0.89m 4.22s 1.57m 12.45s
5/03/2025 2:28:00 PM 1.87m 8.54s 0.9m 4.12s 1.64m 12.62s
5/03/2025 2:08:00 PM 1.74m 8.43s 0.84m 4.14s 1.52m 12.33s

Hs, the Significant Wave Height, may be defined as the average of the highest one-third of waves and is sometimes described as the wave height which would be reported by an experienced observer. The wave climate at any location can be, and usually is, a combination of sea and swell and is often referred to as the total wave. At Geraldton, the division of sea and swell has been set as 8 second period waves.

Tide (Pilot Boat Harbour)

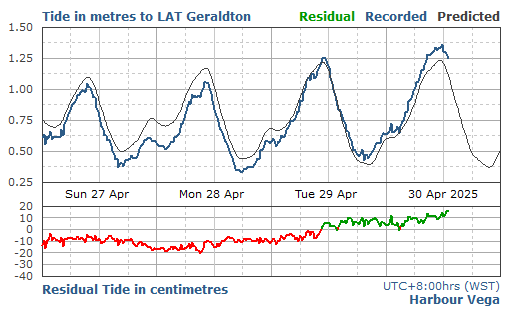
Geraldton Recorded Tide
0.54m LAT

Thursday, 2 July 2026
22:50

Data Breakdown
Residual -4cm
Predicted 0.58m LAT
Data Breakdown
Next Time LAT
High Water 12:58:00 AM 0.68m
Low Water 2:33:00 AM 0.66m
High Water 11:09:00 AM 1.06m
Low Water 7:15:00 PM 0.48m

Unofficial Predictions

Tide
Data Breakdown
Date Time Recorded LAT Predicted LAT Residual
2/07/2026 10:50:00 PM 0.54m 0.58m -0.04m
2/07/2026 10:45:00 PM 0.52m 0.58m -0.06m
2/07/2026 10:40:00 PM 0.51m 0.57m -0.06m
2/07/2026 10:35:00 PM 0.54m 0.57m -0.03m
Current – Outer Channel (Beacon 1 AWAC)

Geraldton

Thursday, 2 July 2026
22:25

Upper 1/3: 0.54 kt to 333.4°(NW)

Upper 1/3
Vector Averaged Current in knot - Upper Third of Full Depth
Current – Outer Channel (Beacon 2 AWAC)

Geraldton

Wednesday, 5 March 2025
16:29

Upper 1/3: 0.26 kt to 335.8°(NW)

Upper 1/3
Vector Averaged Current in knot - Upper Third of Full Depth
Tug Pen Met Wind Data

Geraldton

Thursday, 2 July 2026
22:51

Data Breakdown
Wind Direction SE
Wind Speed(10 min average) 10kn
Gust (2min) 15kn
Barometer 0hPa
Sea Temp -99.9°
Air Temp -0.9°
Tug Pen Wind Data
Berth 3 Met Wind Data

Geraldton

Thursday, 2 July 2026
22:51

Data Breakdown
Wind Direction SE
Wind Speed(10 min average) 3kn
Gust (2min) 8kn
Barometer 0hPa
Sea Temp -99.9°
Air Temp -0.9°
Berth 3 Wind Data
Air Temperature (Beacon 1)

Sea Temperature

Sea Temperature (Beacon 1 AWAC)

Sea Temperature

Oakajee Waverider

Geraldton

Thursday, 2 July 2026
22:45

Data Breakdown
Swell (Hs) 1.88m
Swell Direction 232°
Mean Period 12.8sec
Peak Energy Period 14.6sec
Sea (Hs) 0.93m
Sea Direction 229°
Mean Period 4.8sec
Peak Energy Period 7.1sec
Total (Hs) 2.1m
Mean Period 9.6sec
Peak Energy Period 14.6sec
Maximum Single Wave 3.48m
(recorded previous 15 minutes)
Period 12.9sec
Length 158m
Main Shipping Channel Entrance Wave Data
Data
Date Time Total Sea Swell
    Height Period Height Period Height Period
2/07/2026 10:30:00 PM 1.86m 9.16s 0.89m 4.7s 1.63m 12.74s
2/07/2026 10:15:00 PM 1.93m 9.56s 0.85m 4.78s 1.73m 12.57s
2/07/2026 10:00:00 PM 1.95m 9.88s 0.81m 4.91s 1.78m 12.48s
2/07/2026 9:45:00 PM 1.87m 9.86s 0.79m 5.06s 1.7m 12.37s
2/07/2026 9:30:00 PM 1.62m 9.02s 0.81m 5.06s 1.41m 12.15s
2/07/2026 9:15:00 PM 1.91m 9.75s 0.87m 5.17s 1.71m 12.63s
2/07/2026 9:00:00 PM 2.04m 9.99s 0.86m 5.06s 1.85m 12.68s

Hs, the Significant Wave Height, may be defined as the average of the highest one-third of waves and is sometimes described as the wave height which would be reported by an experienced observer. The wave climate at any location can be, and usually is, a combination of sea and swell and is often referred to as the total wave. At Geraldton, the division of sea and swell has been set as 8 second period waves.